Louisiana Dashboard
Louisiana Dashboard
— PROJECT NAME
Louisiana dashboard
— ROLE
Art Direction
Data Visualization
Graphic Design
Branding
— SOFTWARE
Adobe Illustrator
MS Excel
— DATE
11/2017
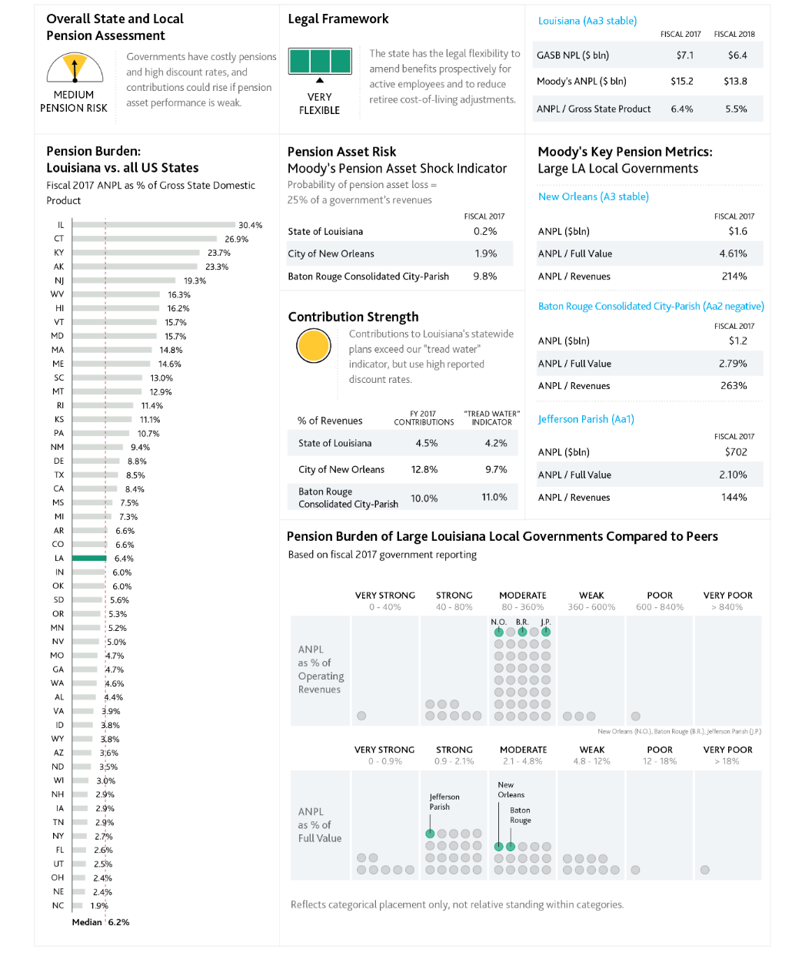
A Moody’s Investors Service analysts based in NYC to visualize multiple sets of their Excel data of the state of Louisiana in a single page dashboard style.
Base of graphic begins in MS Excel and then finalized in Adobe Illustrator to be placed into financial research reports.