USA heat map – Agriculture
USA heat map – Agriculture
— PROJECT NAME
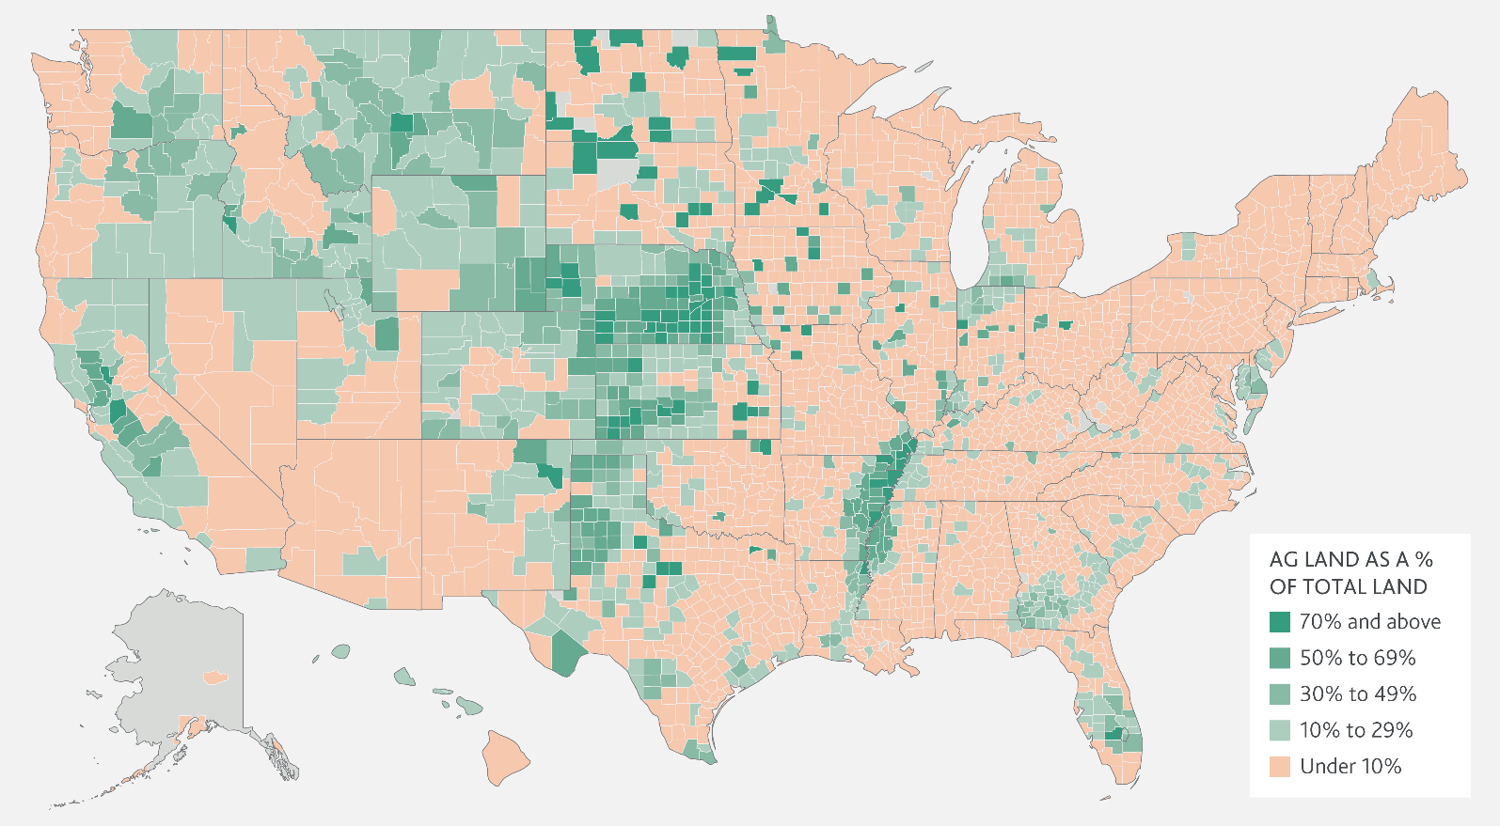
USA agriculture
— ROLE
Data Visualization
Graphic Design
Branding
— SOFTWARE
Tableau
Adobe Illustrator
MS Excel
— DATE
05/2020
Moody’s Investors Service analysts based in NYC and Dallas asked to visualize their Excel data of agriculture percentages within each county in the entire USA.
Base of graphic begins in MS Excel then Tableau, and finalized in Adobe Illustrator to be placed into financial research reports.