— PROJECT NAME
Latin America infographics (LATAM)
— ROLE
Art Direction
Data Visualization
Graphic Design
Branding
— SOFTWARE
Adobe Illustrator
MS Excel
— DATE
02/2019 (Brazil) & 01/2018 (Argentina)
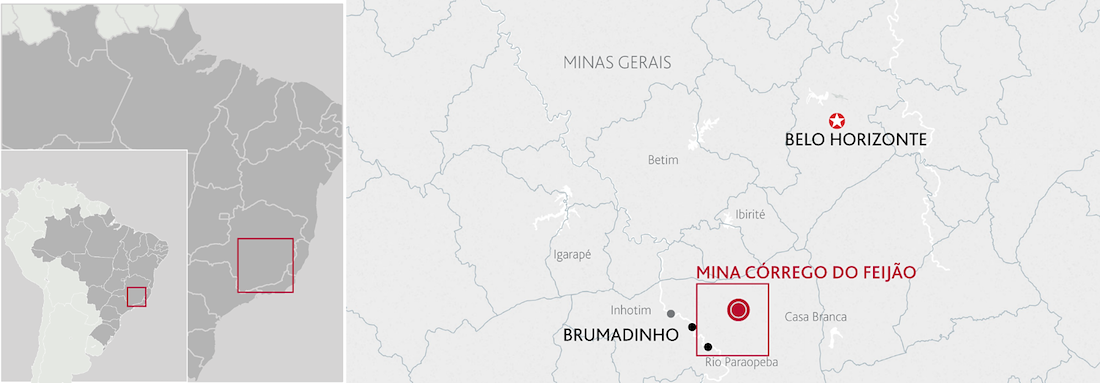
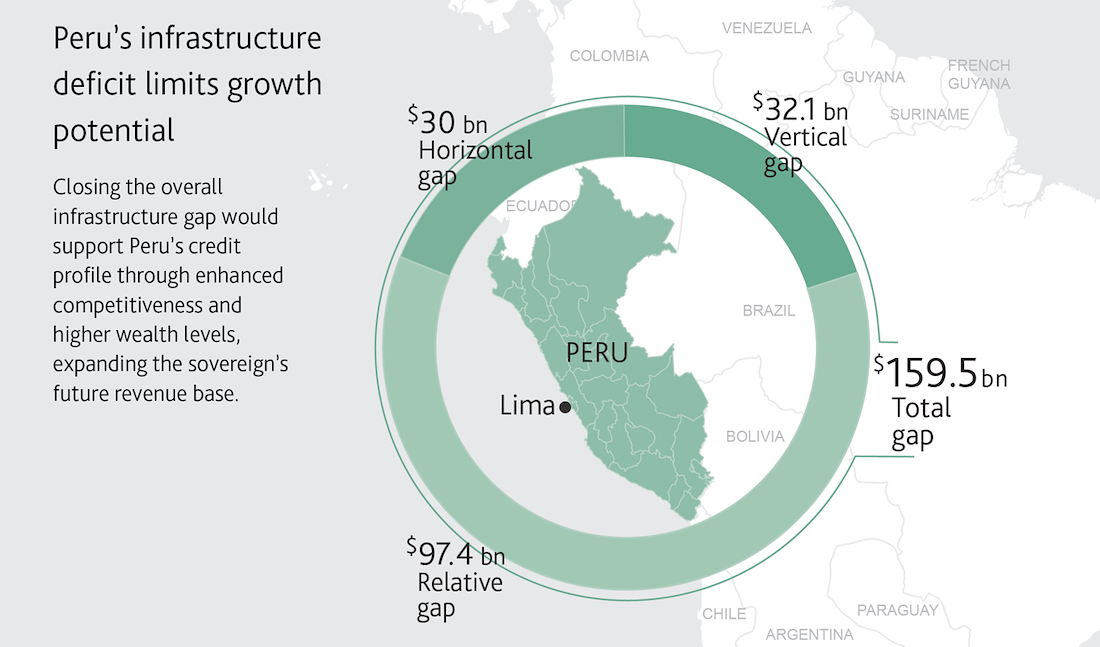
Moody’s Investors Service analysts based in Sao Paulo & Buenos Aires asked to visualize their Excel data into maps with additional charts. These were for two different reports requested at separate occasions. I grouped them here to show how I supported & interacted with clients globally.
Base of graphic begins in MS Excel then transferred to Adobe Illustrator to finalize.
Used the "zoom in/out" technique to show remote locations in South America, at times adding a mini-map so reader can get better understanding of location.