— PROJECT NAME
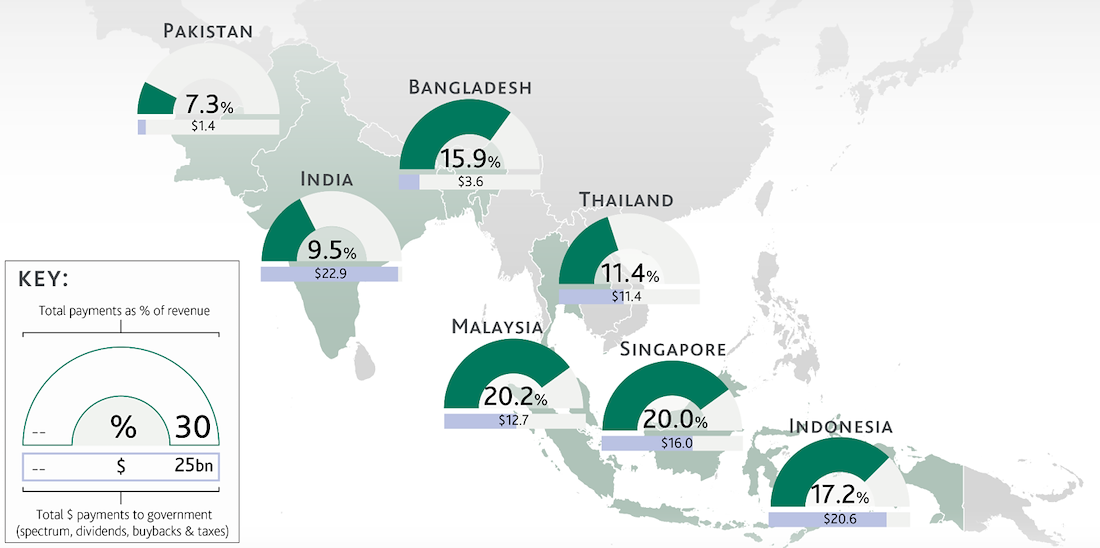
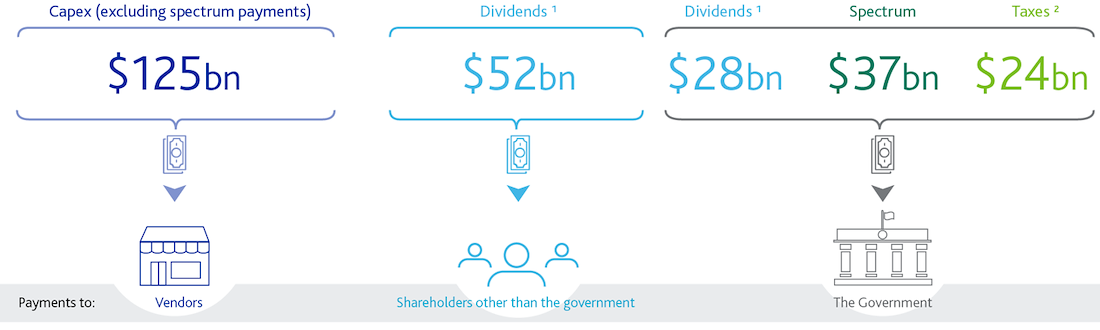
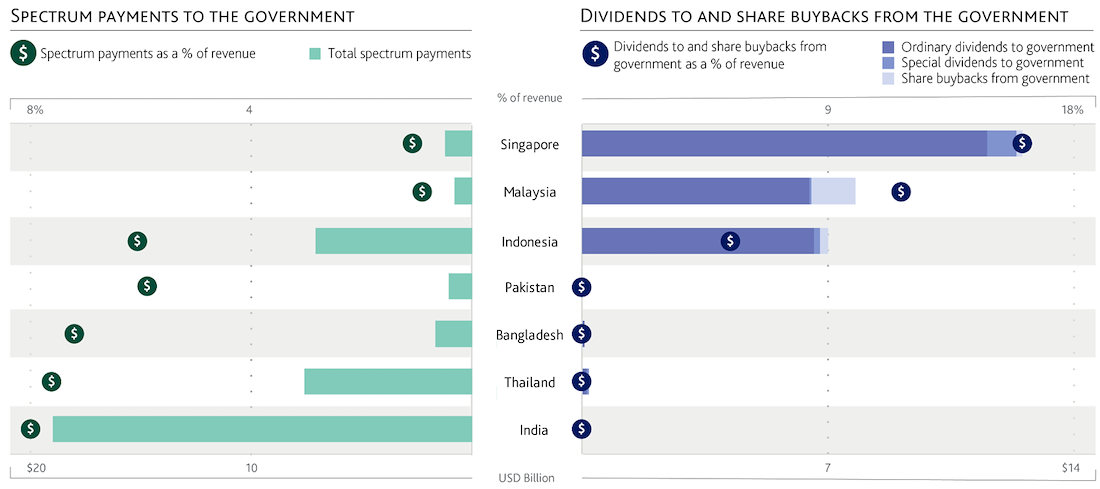
Spectrum vs. Dividends
— ROLE
Data Visualization
Graphic Design
Branding
— SOFTWARE
MS Excel
Tableau
Adobe Illustrator
— DATE
06/2019
Collaborated with vice president analysts in Singapore to enhance the visuals of their native Excel data. These infographics were part of a set and was used in Asia-Pacific (APAC) research reports & PPT slides.
Basis of graphics started in MS Office like Excel & Powerpoint. I refined the designs in Illustrator thereafter.